PID TUNING
The PID controllers are widely used to stabilize the response of any type of system, usually it has to be set with values from the closed loop control system configuration, although in this project that kind of configuration was not conducted due to some problems with the broken pH sensor, which leaded to water leaks that could not be fixed; nevertheless the project team used some of the values obtained from the open loop configuration and a pole placement technique to adjust the values for the PID Controller. After some calculations performed the transfer function was built followed by the PID parameters, which were fed to SIMULINK (MATLAB's software).
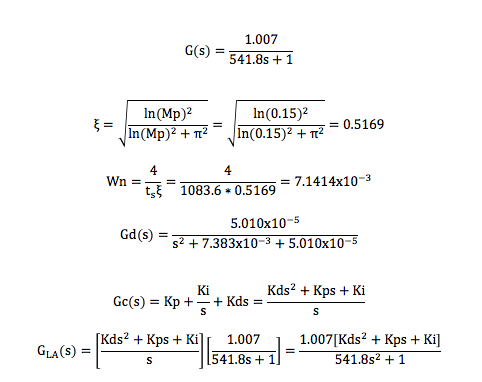
To begin the pole placement technique it was necessary to obtain the transfer function of the open-loop system using the graph obtained; however, the graph is not suitable for obtaining the Tau constant therefore, the team measured the time it took for the system to go from a pH of 9 to a pH of 10; this time turned out to be 14 minutes and 20 seconds. After this time was established, Tau was calculated as being the 63% of the total time, 541.8 seconds. Then the transfer function was obtained using K=1.007 (ratio between the input and the output, in this case, 10 and 10.070 respectively).
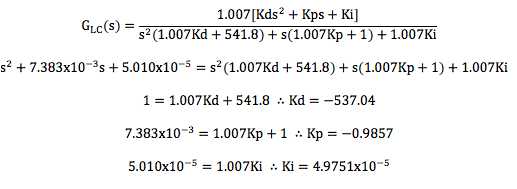
In order to perform the pole placement, two parameters were provided, the setting time (2 times Tau) and the percentage overshoot (15%). The following procedure shows the calculations made for the PID tuning.
This is the block diagram constructed in SIMULINK to apply the PID controller in the closed loop control system configuration:
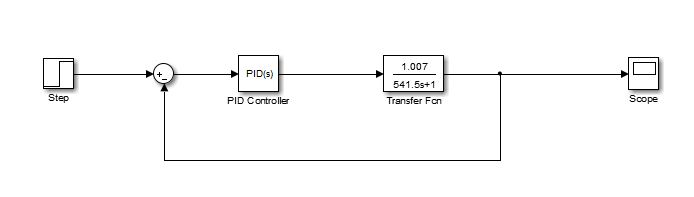
Figure 28. PID system in SIMULINK
To obtain the graph of the response after using the PID controller, these were the parameter used to get the graph.
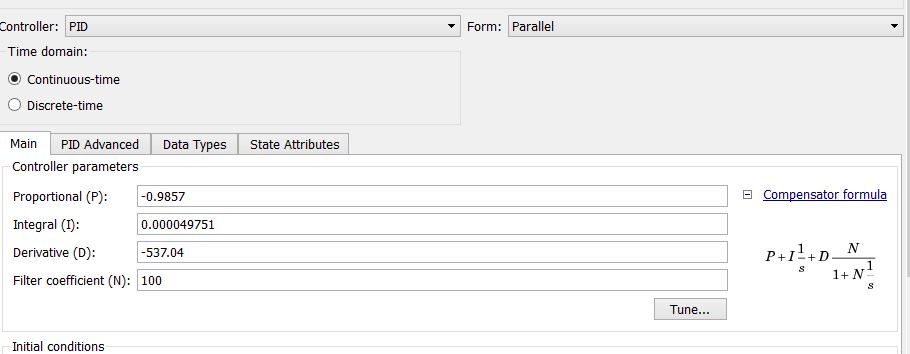
Figure 29. SIMULINK's data entry for the PID tuning
Here is presented the resultant graph after applying the parameters shown before, in blue there is the blocked response while in red there is the tuned response or the desired one, because of the scale the graph, the desired response can not be distinguished correctly.
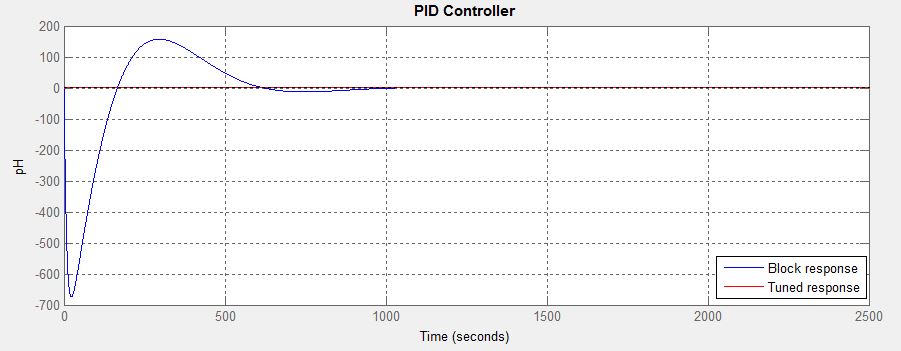
Figure 30. PID graph

Instituto Tecnológico de Estudios Superiores de Monterrey Campus Estado de México.
